Using the MAGPIE GUI
I. Running the MAGPIE GUI on your local machine
MAGPIE is available for use as a GUI. Like the Local-Version of MAGPIE, the MAGPIE GUI can be run on your local machine.
Click here to navigate to the MAGPIE GUI branch on github.
1. Set up the MAGPIE GUI environment
git clone git@github.com:glasgowlab/MAGPIE.git
cd MAGPIE
git checkout GUI
conda env create -f environment.yml
conda activate MAGPE_GUI
2. Run the MAGPIE GUI server locally
python server_local.py
The GUI will be opened in your web browser and is ready to use. All files it creates will be in the current working directory.
I. Getting Started with the MAGPIE GUI
0. Click the button to start uploading your data to the GUI server:

1. Upload a zipfile containing the PDBs to be MAGPIED

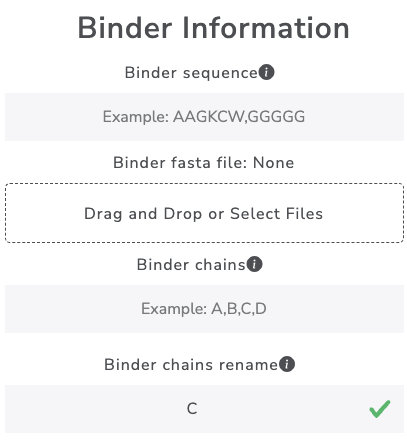
2. MAGPIE input Prep
Enter values to perform the input prep including binder sequence, binder fasta file, and binder chains. It is also possible to rename your binder chain:
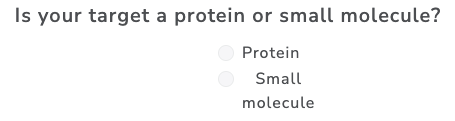
Select whether your target is a protein or small molecule:
If desired, toggle the switch to show advanced options:

For more information on advanced options, see the supplementary material in the MAGPIE paper: Rodriguez et al. 2021.
A. Enter target small molecule information:
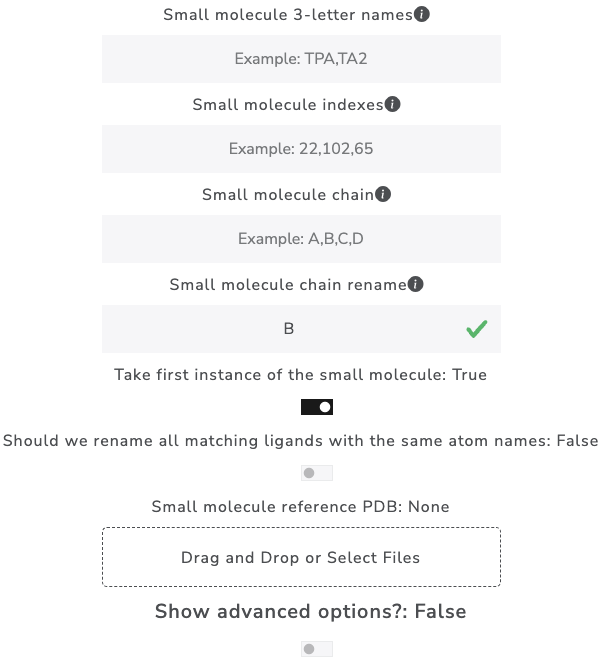
If desired, toggle the switch to show advanced options:
B. Enter target protein information:
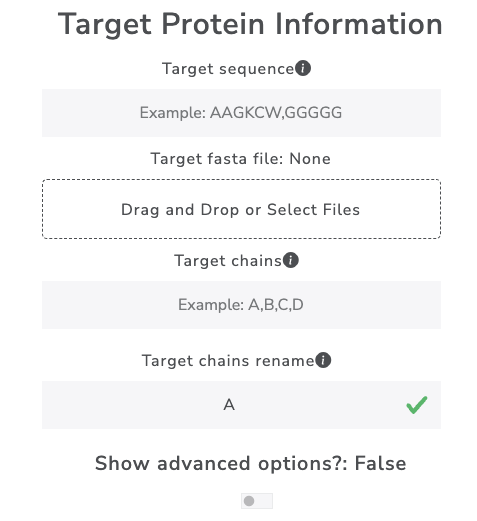
If desired, toggle the switch to show advanced options:
Click the RUN MAGPIE INPUT PREP button:

3. Molecule alignment or Protein alignment:
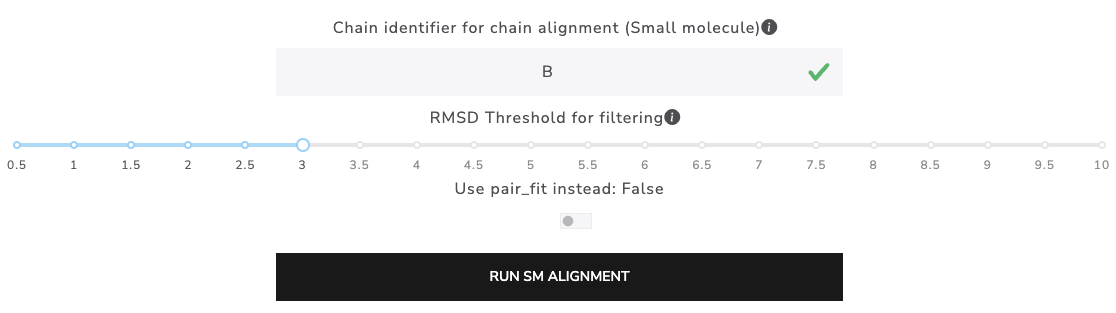
A. Enter values to perform small alignment and clustering:
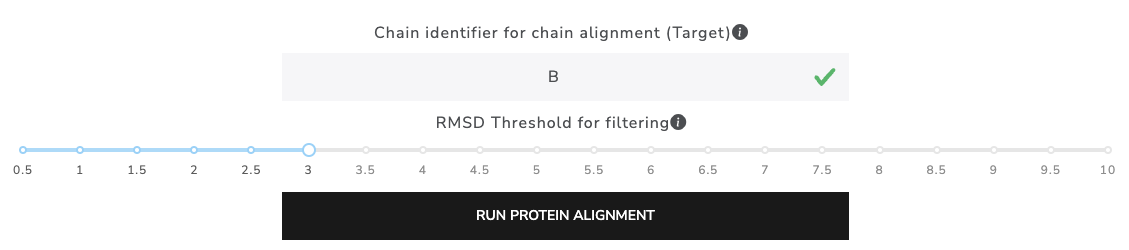
B. Enter values to perform protein alignment and clustering:
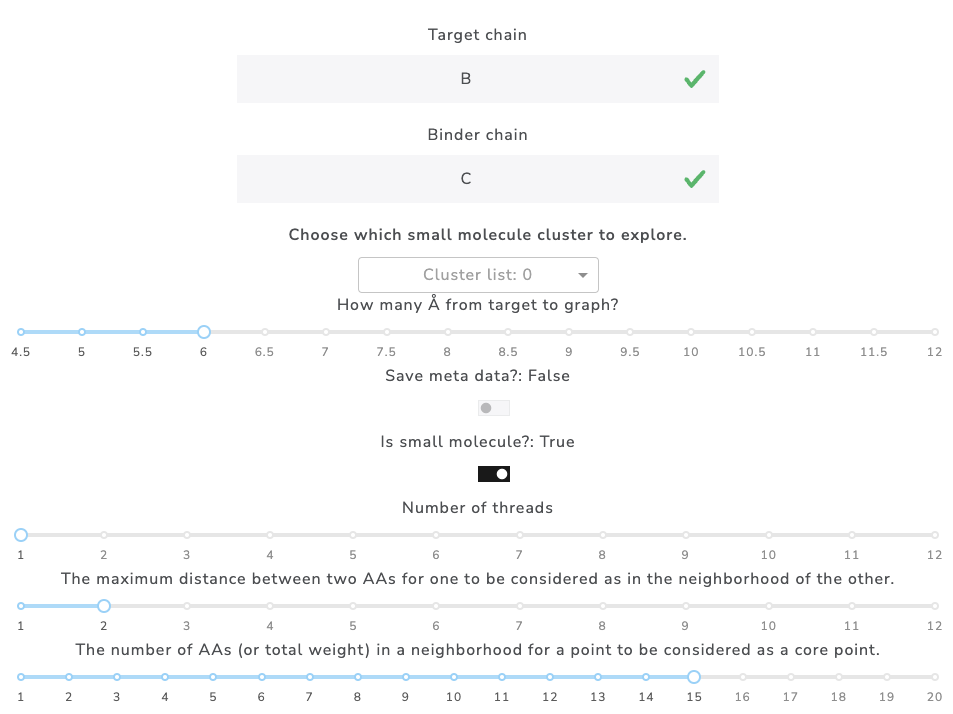
4. MAGPIE it!
Click the Plot points in 3D viewer button:

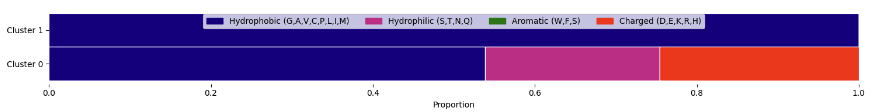
Example DBSCAN cluster output
Example 3D viewer output
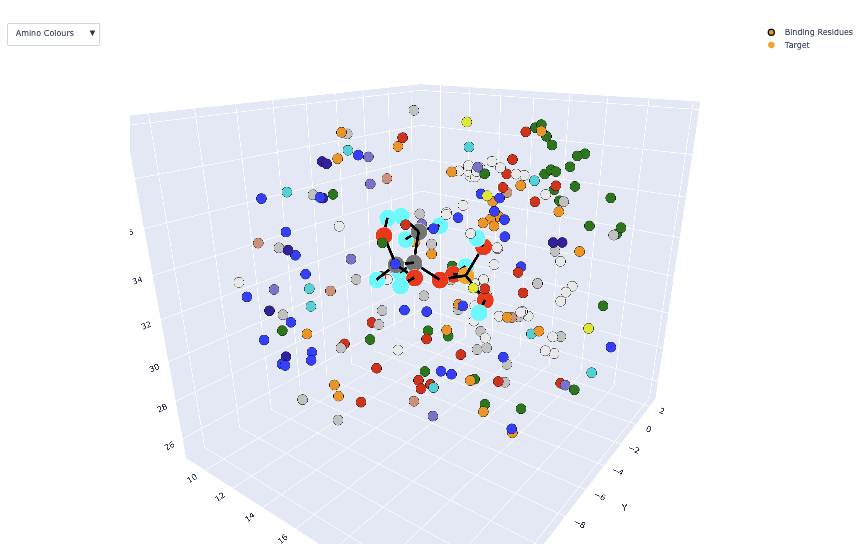
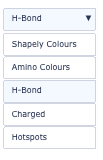
To toggle between 3D viewer settings (Shapely colors, amino colors, H-bonds, charged residues, and DBSCAN hotspots):
To toggle between molecule views:

Download data: